Field work in Tana River
February 22, 2016The Power of Community Mapping and Community Data
November 23, 2016The final step in community land mapping in Tana River County was to design the maps of the two targeted communities. Previous steps are described here, here and here.
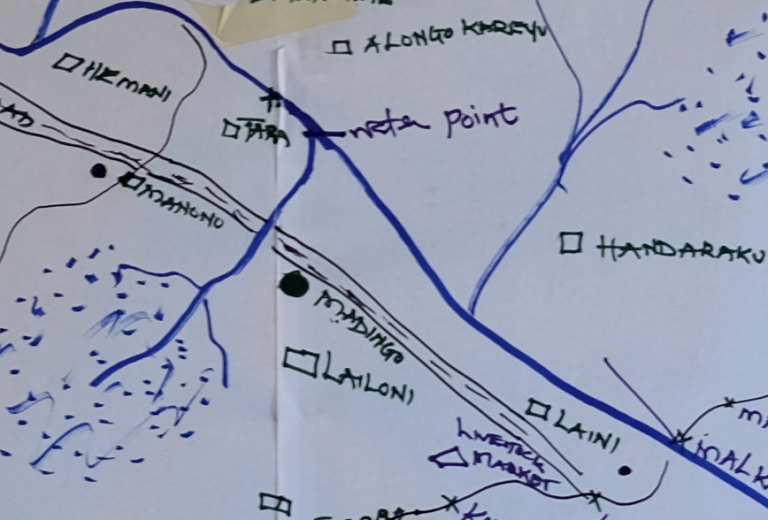
To complete the two maps we used data collected from the field, including GPS files of points and tracks, two drawings made by community members of their community land, notes, and photographs. Additionally, we used DigitalGlobe’s satellite imagery to digitize relevant land features.
Specifically, the final step can be broken down into the following activities:
- Review of data collected through fieldwork
- Selection and purchase of relevant satellite imagery: DigitalGlobe
- Digitization of natural features identified by the communities
- Design of the two maps using QuantumGIS
These were also the final activities of the training process that we offered to Kenya Land Alliance and Namati on how to collect and manage community land data.
Natural resources and amenities that were either gathered in the field or digitized in post-processing and included on the maps were: rivers, brooks and streams; forests; swamps; ocean; sand dunes; grazing areas; farm lands; village locations; schools; hospitals and dispensaries; mosques and churches; water points; roads; air strip; hotels; bridges; and cattle dips.
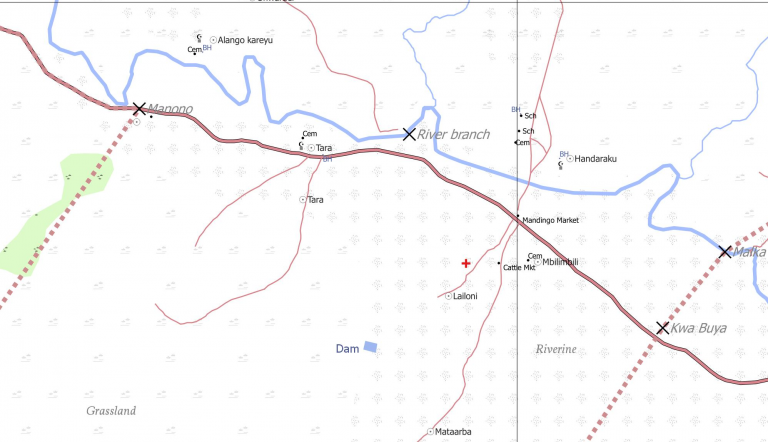
Finally, maps that resemble Topo Sheets in Kenya were designed. We chose this style because it offers a sense of familiarity to the citizens and government agencies to whom they will be presented.
To simply indicate the amount of data gathered by our field teams, we compared it to openly available OpenStreetMap data in the area.
Number of points in OSM: 6
Number of points collected during fieldwork: 126

Comparison between existing rivers in OSM (left) and data generated through and post-fieldwork (right)
Length of rivers in OSM: 91 km
Length of rivers digitized: 381 km

Comparison between existing roads in OSM (left) and data generated through and post-fieldwork (right)
Length of roads in OSM: 103 km
Length of roads digitized: 110 km

Comparison between existing data in OSM (left) and data generated through and post-fieldwork (right)
Areas in OSM: 17 km2
Areas digitized: 590 km2
Images below compare what was first input into the mapping process – community’s drawings of their land – and what was the final output of the process – final georeferenced maps.


